
The real cost of any decision is what you forego by making that choice. In economics, the cost of a decision based on the cost of the next best option is called the opportunity cost. At its most poetic, Henry David Thoreau put it thus: ‘the price of anything is the amount of life you pay for it’.
At first blush that may seem a little extreme, but it is a truth. We are all finite beings and will one day run out of life. Time really is the ultimate constraint. If we had an infinite amount of time, we could do everything we desired and have time left over to enjoy it all.
Over the last few articles of this series, we have looked at two-tier scheduling, the resource management problem and the direction of a solution, as well as the structure of the VMO (value management office) to bring these innovations in schedule and resource management into being. All these components play a part in delivering more of your goal within the time you have available to do it. However, as necessary as they are to optimising individual projects, by themselves, they are not sufficient to make more intelligent decisions between the different initiatives arising from your strategy and business plan.
In the world of finance, portfolio management is the art and science of making decisions about investment mix and policy, matching investments to objectives, asset allocation for individuals and institutions, and balancing risk against performance. Project portfolio management (PPM) refers to a process used by project management organisations to analyse the potential return on undertaking a project. Managers can use PPM to see the big picture and make decisions about what’s out and what’s in.
‘The price of anything is the amount of
life you pay for it’—Henry David Thoreau
In both the world of finance and the world of projects, the goal is to maximise the return on resources invested in creating value from an idea. Typically, this will be calculated using two related ideas: the net present value (NPV) and the internal rate of return (IRR). The idea behind NPV is to calculate all of the cash flowing in and out of your investment over a predetermined time to tell you what those flows are worth if all of it were converted into a single equivalent capital amount today.
The NPV on any given project is heavily dependent on the assumptions of the positive and negative cash flows, as well as the rate of interest used to discount the value of the money you will only realise in the future. Hence, the technique used to determine NPV is called ‘discounted cash flow’. IRR is related to NPV in that the IRR is a target baseline discount (interest) rate that calculates the net present value (NPV) of all future cash flows from a particular project to come out as zero. Therefore, if you can achieve more than the internal rate of return, the project is—technically, at least—worth taking on.
Working with limiting factors
As described in my recent article on constraint accounting, no less a figure than the late Stanford Professor Charles T Horngren stated that ‘relevant information is the predicted future costs and revenues that will differ among alternative actions. The existence of a limiting factor changes the basic assumptions underlying the cost and revenue opportunity of a particular action.’ Thus, if the particular ‘action’ we are talking about is selecting which projects from a portfolio will deliver the best return on investment, then rank ordering on the basis of NPV is not sufficient.
What we need to do to properly evaluate the best decision, based on Horngren’s idea of a ‘limiting factor’ is to introduce the idea of project octane. What I mean by project octane is how much NPV the project delivers for per unit of the critically constrained resource (CCR). Because projects are always competing for finite resources.
Let’s imagine you are evaluating a portfolio of 10 projects, each of which has been evaluated on the basis of its NPV. You are satisfied with the assumptions your team have made with regards to the value each project will deliver and they have been very diligent with their scheduling. You are able to drill into all resource requirements and what they have produced confirms your intuition that the critically constrained resource is your pool of solution architects. You can readily ramp up all other resource types but, for the technology platform you are using, you are simply unable to contract more than 80 solution architects.
When you first look at the portfolio, it looks like the table below:
Scenario 1:

Based on the availability of only 80 of your critically constrained resource (CCR), we can only, strictly speaking, do the first two projects, and at a squeeze, perhaps get the third one in. Total NPV for the executable portfolio is therefore between $1.9bn and $2.7bn.
Scenario 2:
If however you add to the table the project octane for each project—that is, how much NPV is delivered for each unit of the CCR—and then rank them according to the octane, you end up with a very different scenario and value proposition:

If the number of available solution architects is truly your only constraint, you could run all the projects in green in parallel. In this case, only the last project cannot be completed. Therefore, the total NPV is $4.5bn, or a 67% improvement on scenario 1. Project 10, with its billion-dollar NPV, looked very attractive. Looking at project octane helps us see where true value lies.
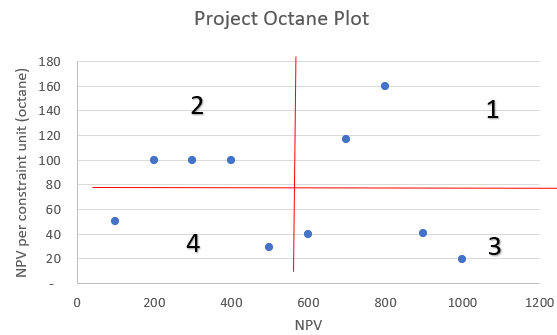
In the diagram above we can visualise this octane idea by plotting each project against two axes—the x axis representing the NPV and the y axis the project octane. The red lines indicate the average NPV and the average octane across all ten projects.
Quadrant 1: DYNAMO. These are the most desirable projects to do. They deliver the highest NPV and also have a high octane—that is, they are relatively low on consumption of the CCR and thus deliver a high bang for buck invested in them.
Quadrant 2: DREAMER. These projects have a relatively high octane (good bang for buck for the use of the CCR), but don’t generate enough NPV to move them into quadrant one. Some questions you could ask about these projects are: what can be done to increase the revenue (benefits) from these projects? If it’s a product or service offering, for example, would lowering the price lead to a significant and disproportionate increase in sales volume?
Quadrant 3: DELIVERER. These projects generate a relatively high NPV, but they are also proportionately more consumptive of the CCR than those projects in quadrant one. The question to ask of the projects in this quadrant is: what can be done to offload some or most of the work onto resources which are not as constrained as the solution architects? Perhaps the work can be looked at more closely and the constraint mantra applied: ‘let the constraint do only that which only the constraint can do’. What can be delegated to people who can support the CCR and thus liberate their capacity to do only that which only they can do?
Quadrant 4: DEADBEAT. As one wit put it, the projects in quadrant four are not only the dogs but are the fleas on the dogs! There would be two rounds of heavy-lifting to do to make these projects more attractive: increase the benefits and reduce the consumption of the CCR. It may be possible. But, once again, you have to ask yourself the opportunity cost question: where is your limited attention better spent? On the high-value projects or on wrestling the recalcitrant into submission?
I have found that the idea of project octane doesn’t have to be as quantitatively precise as expressed in these charts. It is best to set the intention to rise to a level of project maturity that makes the quantitative assessment second nature. But the truth is that good managers can usually get a pretty solid intuitive idea of octane without having to do the numbers. Just think about how ‘sticky’ or ‘viscous’ the project seems.
You would know that the numbers you get from a pure NPV calculation make you scratch your head and intuit that there is something not quite right—your critically constrained resources are spending too much time on a project when they could be cranking out a lot more, in a far more streamlined fashion, if allowed to work on those projects which consume less of their precious time. Using all of the tools that come from the ability to quantitatively articulate the load of your portfolio of work and the capacity available to deliver it can end up making you a lot more money, both now and in the future.
There is, of course, another option—the ‘uplift’ step of the 5-Step FOCUS. As one TOC guru put it, ‘when you’ve squeezed all the blood from a stone…get more stones’. Having the ability to quantitatively articulate the demand for resources, by type, in time and place, gives you the ability to pinpoint any further investment in capacity to provide the greatest leverage in value.
____________________________
What’s next?
The change from standard thinking to Theory of Constraints (TOC) is both profound and exhilarating. To make it both fun and memorable, we use a business simulation we call The Right Stuff Workshop.
We’d love to run it with you. To learn more:
[Background photo: ‘Umbrellas’ by Ricardo Resende on Unsplash]
“Efficiency is doing things right;
effectiveness is doing the right things”
—Peter Drucker
Healthcare professionals are central to the patient’s progress from awareness of a therapy to successful long-term use. They identify risk, interpret evidence, diagnose conditions, discuss options, perform procedures, provide training and monitor outcomes.
Yet many medical device development programs treat healthcare professionals primarily as users to be trained or customers to be persuaded.
HCP-Centered Design takes a wider view. It examines the work healthcare professionals must perform, the system in which they perform it and the constraints that limit their ability to move suitable patients through the care pathway.
“If patient flow depends on a healthcare professional, that professional’s available capacity may determine how many patients ultimately receive the therapy.”
A medical device patient journey commonly depends on several healthcare professionals:
Each professional governs a transition in the flow of patients.
If one transition lacks sufficient capacity, information or clarity, the whole pathway slows. More marketing, sales activity or production capacity will not compensate for a shortage of specialist time or a burdensome diagnostic process.
This is why HCP-Centered Design is not simply about making an interface easier to use. It is about enabling the system of care to perform.
A healthcare professional’s work depends on information and actions supplied by others. They may rely on referrals, patient histories, pathology, imaging, electronic records, clinical guidelines and the availability of equipment or trained colleagues.
After reaching a decision, they may need to explain it, document it, arrange authorization, coordinate treatment and prepare the next person in the pathway.
A technically strong solution can still create difficulty if it:
The relevant design question is not merely, “Can the HCP use this product?”
It is, “Does this solution improve the HCP’s ability to complete important clinical work within the conditions in which care is actually delivered?”
“HCP” is not one persona.
A general practitioner, specialist, interventional physician, nurse, technician and clinical administrator encounter different stages of the pathway. Each has different responsibilities, authority, expertise and exposure to risk.
Even within a profession, context matters. An experienced specialist in a major hospital may approach the same task differently from a professional who encounters the condition infrequently or works without immediate specialist support.
Useful HCP personas distinguish factors that influence work:
These personas clarify who performs each job and what support each person requires.
The HCP journey often begins before the visible clinical procedure.
It may include receiving a referral, gathering information, forming an initial view, ordering investigations, interpreting results, deciding whether the patient is eligible, discussing treatment, obtaining authorization, preparing for the procedure, delivering care and arranging follow-up.
At each stage, ask:
The resulting journey map should distinguish processing time from waiting time. A decision may require only minutes of specialist attention while patients wait weeks to access that attention.
This reveals the practical relationship between HCP capacity and patient flow.
The Theory of Constraints directs attention to the factor limiting the performance of the entire system.
In some pathways, the constraint may be the number of qualified interventional specialists. In others, it may be diagnostic capacity, physician confidence, authorization effort, operating room access or the time required to train patients.
The constraint may also be hidden inside the HCP’s working day.
A specialist supporting a therapy must still manage other clinical duties, administration, meetings, documentation and urgent cases. The question is not simply how many specialists exist. It is how much of their usable capacity is available for the activities upon which patient flow depends.
“The scarcest resource may not be the healthcare professional. It may be the few hours of focused capacity available for the critical work.”
Improvement away from this constraint can make performance worse. Sending more referrals to an already overloaded specialist increases the queue. Adding information may increase cognitive burden. Creating another approval may consume the capacity required to treat patients.
HCP-Centered Design seeks to protect and expand the capacity that governs flow.
Policies and procedures describe how clinical work should happen. Observation reveals how it actually happens.
Healthcare professionals routinely compensate for missing information, awkward interfaces and unreliable handovers. These workarounds may become so familiar that nobody reports them as problems.
Gemba research should examine:
The purpose is not to judge the healthcare professional. It is to understand the system surrounding the work.
“A workaround is often evidence that the system has failed to support the person doing the work.”
Healthcare professionals do not simply use devices. They use them to make progress in clinical work.
An HCP may need to identify risk, reach a confident diagnosis, select an intervention, perform a procedure safely, explain options, monitor progress or recognize deterioration.
A structured job map divides this work into eight stages:
This wider view prevents the product team from concentrating exclusively on the procedure.
The greatest value may come from reducing preparation, improving decision confidence, clarifying an exception, simplifying documentation or improving the handover to follow-up care.
Comments such as “the interface is difficult” or “we need better information” indicate dissatisfaction, but do not provide sufficient direction for design.
They should be translated into measurable outcome statements, such as:
“Minimize the time required to identify which clinical information is missing before making a treatment decision.”
Or:
“Reduce the likelihood that a clinically significant change goes unrecognized between scheduled reviews.”
A broader population of healthcare professionals can then assess the importance of each outcome and their satisfaction with their current ability to achieve it.
Highly important and poorly satisfied outcomes provide a rational basis for prioritizing innovation.
“Adoption follows when a solution makes important clinical work safer, clearer or easier to complete.”
The five-step FOCUS process creates a practical improvement cycle.
Find the constraint. Determine which HCP activity or resource currently limits patient flow.
Optimise for it. Protect the constraint from avoidable work, missing information, interruptions and rework.
Collaborate around it. Align upstream and downstream teams so patients, information and resources arrive when required.
Uplift it. Add capacity, redesign responsibilities, improve technology or remove restrictive policies.
Start Again. Identify the new constraint once flow improves.
This approach allows the organization to distinguish activity from value. It also turns HCP engagement into an ongoing management discipline.
HCP-Centered Design must connect clinical reality with patient needs, technology, regulation and business strategy.
A Value Management Office can help coordinate these perspectives across the product lifecycle. Its role is to ensure that projects, resources and stage-gate decisions remain connected to patient flow and business value.
The organization should be able to show:
The goal is not simply a device that healthcare professionals can operate. It is a solution they can confidently incorporate into care and a delivery system capable of getting that solution to more patients.
Use the HCP-Centered Design assessment to determine how well your organization understands clinical work, HCP capacity and the constraints governing patient flow.
The resulting evidence should guide product design, process improvement and investment toward better products, delivered faster, with more lives changed for good.
Medical device companies devote enormous skill and investment to developing safe, effective products. Yet a technically successful device changes no lives while suitable patients remain unable to reach it.
Between a patient becoming aware of a therapy and receiving its intended benefit lies a pathway of referrals, consultations, diagnostics, approvals, procedures, training and follow-up. Every step consumes time. Between the steps, patients wait. At some points, they become confused, discouraged, ineligible or lost to the process.
Patient Centered Design must therefore address more than the design of the device. It must improve the performance of the entire system through which patients reach, receive and live successfully with the solution.
“A life-changing therapy changes no lives while patients remain trapped in the pathway leading to it.”
A typical medical device journey may include:
Companies often manage these stages as separate functions. Marketing works on awareness. Medical affairs supports clinicians. Market access addresses reimbursement. Sales works with specialists. Clinical teams gather evidence. Training teams support adoption.
The patient, however, experiences one journey.
From the patient’s perspective, a delay between two organizational functions remains a delay. A repeated test remains repeated work. An unclear handover creates uncertainty regardless of which department owns it.
Patient Centered Design begins when the organization sees and manages this journey as a connected system.
Every step contains some necessary processing time. A consultation takes time. A diagnostic test takes time. An authorization must be assessed. A procedure must be performed.
The patient’s total lead time, however, also includes the waiting between these activities.
A consultation may take 30 minutes, but the patient could wait six weeks for it. A diagnostic test may take an hour, followed by another delay before a specialist reviews the result. Prior authorization may require little actual work while adding weeks to the pathway.
This distinction matters because organizations often improve processing time while leaving the larger queues untouched. Saving five minutes during an appointment produces little benefit if the patient waits months to reach it.
Patient Centered Design therefore asks:
The answers reveal the true performance of the patient system.
Theory of Constraints teaches that the performance of any system is limited by a constraint. Improving a part of the system that is not constraining flow may create more activity without increasing results.
If diagnostic capacity is the constraint, generating more awareness may simply produce a longer queue for diagnosis. If specialist capacity is the constraint, accelerating authorization may move patients more quickly into another wait. If training after first use is inadequate, increasing procedures may produce poor experiences and avoidable follow-up demand.
“More activity at a non-constraint creates work in process. More capability at the constraint improves the system.”
The constraint is not always a physical resource. It may be a policy, an eligibility rule, missing evidence, a fragmented handover, an information delay or the cognitive burden placed on the patient.
The most important question is therefore not, “How do we improve every step?”
It is, “What currently limits the flow of suitable patients to successful use of the therapy?”
Numbers show where patients are lost. Patient research helps explain why.
Two patients with the same diagnosis may respond very differently. One may actively seek new treatment options. Another may delay action until symptoms become severe. A third may want help but lack confidence in navigating the healthcare system.
Meaningful patient segmentation considers characteristics that influence behavior:
These differences affect whether patients enter the pathway, remain engaged and successfully adopt the solution.
The Gemba is the place where work actually happens. For patients, this includes the home, clinic, hospital and all the places where they manage their condition between formal encounters.
Interviews alone may miss important evidence. People normalize inconvenience, forget workarounds and simplify their past decisions. Observation allows the development team to see what patients actually do.
Good research combines three activities.
Observe. Watch how patients obtain information, prepare, use the solution and respond when something goes wrong.
Immerse. Understand the physical, emotional and practical conditions surrounding the experience.
Engage. Ask open questions that allow patients to describe their goals, fears and frustrations in their own language.
The purpose is to discover the patient’s reality before asking them to evaluate the organization’s preferred answer.
Patients rarely want a medical device for its own sake. They want the progress it may enable.
They may want to recognize deterioration earlier, preserve independence, reduce pain, avoid repeated visits, return to work or prevent a disease from controlling daily life.
A useful job map examines eight recurring stages:
This reveals opportunities beyond the immediate use of the device. The most valuable improvement may involve helping patients prepare, confirm readiness, recognize an exception or understand what happens next.
Stories create understanding, but investment decisions require structured evidence.
Patient observations and comments should be converted into outcome statements that identify:
For example:
“Minimize the time required to recognize that my condition has changed sufficiently to require clinical help.”
Patients can then assess the importance of each outcome and their satisfaction with their current ability to achieve it.
Highly important and poorly satisfied outcomes represent genuine opportunities. This prevents teams from prioritizing attractive features that do not materially improve the patient’s life or progress through the pathway.
“Innovation becomes valuable when it improves an outcome that matters and remains poorly served.”
The Patient Centered Design pathway can be improved through a repeating discipline:
Find the constraint. Identify what currently limits patient flow or successful use.
Optimise for it. Make the best possible use of existing constraint capacity.
Collaborate around it. Align functions and partners so their actions support the constraint.
Uplift it. Add capability, remove restrictive policies or redesign the pathway.
Start Again. Once the constraint moves, identify and address the next limiting factor.
This prevents improvement from becoming a collection of disconnected initiatives. It directs scarce resources toward the factor that most strongly governs the result.
Patient insight should influence more than early product design. It should shape clinical evidence, regulatory strategy, reimbursement, manufacturing, education, market development and post-market support.
The organization should be able to show:
The goal is not simply to place the patient at the center of a diagram. It is to organize the enterprise around delivering better products faster, so that more lives can be changed for good.
Use the Patient Centered Design assessment to determine how well your organization understands its patient journeys, priority outcomes and constraints to patient flow.
The result should be more than another collection of patient opinions. It should provide evidence that directs strategy, investment and execution toward the changes that matter most.
Discover better ways to do better work.
We alternate our own actionable articles with three relevant links from other authorities.
We’ll only use your email address for this newsletter. No sales callsDiscover better ways to do better work.
We alternate our own actionable articles with three relevant links from other authorities.
We’ll only use your email address for this newsletter. No sales calls